IPCO Internship
This summer I had the opportunity to work at the power company for much of the Boise area, Idaho Power. The opportunity to work at Idaho Power was unexpected to say the least, as it is a coveted internship and I have only had a single power class in my time at BSU, so my practical and mathematical understanding of power at the time was limited to say the least.
This summer I had the opportunity to work at the power company for much of the Boise area, Idaho Power. The opportunity to work at Idaho Power was unexpected to say the least, as it is a coveted internship and I have only had a single power class in my time at BSU, so my practical and mathematical understanding of power at the time was limited to say the least.
During my first interview, at one point I forgot how to calculate power, and had to ask if I could use my notes from my Renewable Power class, definitely a little embarrassing. Many of the other questions were about topics I didn’t have a lot of knowledge to answer well, so I found myself giving it my best shot, but ultimately telling them I don’t know how to calculate that. All to say, I didn’t expect to get a second interview.
I did get a second interview thankfully, in which I was asked about different scenarios and how I would react. Situations like, how would you work with a coworker who is obstinate, how have you in the past resolved conflicts, etc. One question that stuck out to me was how I see Idaho Power adapting to big changes in power loads and generation, such as Electric Vehicles, (EVs) and the push for renewable energy. My answer was long but I recall mentioning how renewable energy sources often are unstable, and EVs draw a massive amount of power, a difficult combination.
I actually have an EV myself, a 2012 Nissan Leaf that can get around ~30 miles @ 80% charge, ~35 miles @ 100%, so my understanding of the pros and cons are visceral for me. As a result I had done a bunch of research on the chargers and different types of EVs to figure out what would work best for me. When I mentioned this, a few other questions came up, and ultimately the biggest summer project was related to EV’s.
When I first learned I was working with the Methods & Materials (M&M) department I was very confused, as I am not a materials engineer, and the name made it sound like I was going to be doing material work. However, the M&M department at Idaho Power, would be what is considered the standards department anywhere else. The group I worked for is in charge of setting and evaluating the standards and methods that the Company uses to build and evaluate much of the power infrastructure, and determine the materials that will be used.
One interesting facet of working in the Methods & Materials department is that with the global material shortage, the M&M department was responsible for finding replacements and fixing materials failures. I had the chance to learn how IPCO dealt with material failures and saw how difficult it can be to maintain the amount of growth that Idaho is experiencing while being short of the materials necessary for electrification. On a few occasions I went out with my mentor and followed different crews around who were installing the cabling to new housing developments, and got to visually trace how the dense residential areas are laid out to allow for all of them to get power.
My Project
My summer project at Idaho Power was generally to look at how EV’s and their adoption over time would impact the electric grids loading on a residential level. To do this my first task was to understand and figure out how to collate data gathered via Idaho Power’s Automated Metering System (AMI) that all residential dwellings have attached. These AMI meters I find really interesting, they actually send data by short circuiting the AC power signal at the zero crossing to send a binary coded signal. Because the power oscillates at 60Hz the signal sent takes a while to send and receive, but it’s an effective and low cost solution.

My mentor in the M&M department had collected some AMI data which consisted of hourly power use data for around six transformers in a neighborhood and performed two methods of analysis to the data. The first and simplest to complete was Sum of Peaks. Sum of Peaks consisted of looking at individual meters on a transformer and find their all time highest power draw, then adding all of these peaks together to get the highest possible power draw on the transformer. The benefit of Sum of Peaks (SoP) was that it represents the worst case scenario for power draw if all attached meters draw their max power at the same time. It also allowed the data to be broken down into the Sum of Peaks of each hour over the course of the day so you could see how the peak power use changes over the course of the day. The second method of analysis was Peak of Sums (PoS), which consisted of looking at transformer, and finding the highest actual power draw over a given timeframe. This method presents a more realistic power draw at a given time, but data could only be broken down by month, so the hourly detail is lost.
I generally opted to use PoS as it provided a more realistic power draw, but it also was more reflective of the diversity factor of a transformer. The diversity factor is an equation that is used to estimate when individual meters on a transformer hit their peaks. Households often hit their highest energy usage in the later afternoon, but not all hit their peak at the exact same time. The diversity factor equation takes the number of meters attached, and is meant to represent and account for the different peak times for households on a transformer.
After determining how I wanted to analyze meter and transformer data, I collected data for 123 transformers with nearly a thousand meters total. This data came in the form of an excel sheet with the transformer ID, meter ID, date, time & power use in the hour. To sort this data, my mentor used excel to find the PoS and SoP for a few transformers only, and he told me it took a while to sort out. Particularly Peak of Sums was difficult as you had to add each individual hour of each transformer together and compared to the others, while SoP you could just find the maximum value in an array. My mentor in his first go at this told me it took several hours to do PoS for a single transformer, so to ensure I could do this efficiently I decided to write a program that would load all the excel data into a few different arrays and then perform SoP and Pos, kicking out the collected data back into an excel file where it could be used for further analysis.
While initially I wanted to use MatLab, after talking to a professor and now summer coworker, and learning a Matlab license costs a few thousand, I went with Python, and the Python library OpenPyXL. This library allows the reading writing and evaluating of an excel document providing all of the excel functionality I needed and more. I built a few different python structures to accommodate the data that was collected, and then further functions to collate it into the information I wanted. This data was then organized into an Excel sheet, color coded, broken down by transformer location and which analysis was done. Putting the program together took around two weeks of intense work because OpenPyXL was new, and I haven’t gotten the chance to write a big program for a while. Working on it allowed me to check into the hyperfocus part of my brain, and it was interesting because normally when I focus, I can focus for as long as needed. Working 8 hour days, I had stop and pick up where I left off many times not only after work, but also to talk to coworkers. I found I had a hard time bringing 100% of my attention back to what I was working on and determining where I had left off. This meant I found myself evaluating and revaluating sections of code I wrote previously and led me to creating very thorough comments that explained what everything did so I didn’t have to start from zero every time my attention was diverted. This is generally accepted as good practice anyway, but this really is the first time I’ve found it necessary to write comments to myself, for myself.
This collected data measured the current transformer loads across the Idaho Power (IPC) territory currently, to look at the impact of EVs I opted to do two methods of measuring the impact. The first used the SoP transformer data, EV charger level statistics and three different adoption curves that projected EV adoption to find how over time as more households have EVs, how the grid would impacted. This model allowed me to find in detail how residential transformers would be impactd as more EVs were attached.
The second method used PoS data and utilized a survey IPC has had available on their site, where people can go on and if they have an EV, put the make, model of their car and their address. After filling it out myself I was able to analyze the transformers of people who bought an EV were attached to, and see how their power usage has changed in comparison with their neighbors. I used the same python program I wrote previously to analyze the change per year on each of these transformers. This showed that there was a significant power increase in houses that had EVs, averaging out to an increase in a 6kWh during peak hours. The difference was obvious, not only compared to power use prior to the neighbors, but especially so in comparison to years prior to the EV purchase. This 6kWh increase I believe is due to Level 2 EV chargers which generally are sized at 6kWh, and it was applied on the hourly SoP data to find the increase.
Both of these methods gave similar results, as both demonstrate that as more households have EVs and EV chargers, we will see more transformers overloading. Overloaded transformers present a problem because it leads to poor power quality, voltage flicker, and if it remained overloaded, it could cause all power to be lost to the attached meters. My recommendation summarized is to upsize some of the smaller residential transformers by a size, and for some of the larger transformers, use a relatively new transformer oil, FR3, which allows up to 20% additional load. FR3 is also soybean based, compared to mineral oil which is oil based, so it is better for the environment as well. The good news here is that the most aggressive adoption curve I used with the first model, had only 15% of transformers overloading in 2050 when approximately 70% of households would have EV. That means there is an approximate 30 years before overloading becomes a problem. Pushing that same prediction out to 95% which is predicted to happen in 2093, around 30% of the transformers overload. So we have a while before serious overloading becomes an issue, and by being proactive, serious issues can be avoided. The second model based on the survey model, only had around 10-15% of the transformers overloading, still an issue but this model doesn’t give us a timeline in which it would happen.
There was a study I found that did a similar study on a larger level, titled Distribution grid impacts of electric vehicles: A California case study that says around 20% of the circuits across the PG&E territory will need to be upgraded. This number is close to the number both the models I developed, which is encouraging, though the California study encompassed all levels of distribution, not just residential from what I could tell. The first model can seen as a worst case scenario, and the second a best case, and averaging them out, we come to a number similar to the 20%, though my study only consisted of residential transformers, not transmission level transformers and circuits, which will be a crucial consideration in the future.
My second project at Idaho Power was to create a Line & Transformer loss calculator. This project, while smaller in scope presented more mathematical difficulties for me. The first project was a lot of number crunching, programming, and analysis, while the loss calculator required much more power maths and understanding. Initially I was really struggling to understand how power was transmitted and lost on a transmission line via inductance and resistance. My coworkers were kind enough to spend a lot of time working with me and helping me understand power, how it is transmitted and how it is lost. These fundamentals are concepts I struggled with previously and getting the chance to talk with experienced engineers, I really started to understand the concepts I had been struggling with in class.
The power loss calculator I developed was to ensure that the loss power values that the meters calculated for industrial customers were correctly calculating the power lost between the meter itself, and the point that Idaho Power connected to the customer. After learning about line losses, learning about transformer losses was a natural development. I will be taking my first full power class this next semester, Fall 2022. Concepts that I had struggled with in concept, such as Line-to-Line voltage, and a transformers high vs, low side were all taken into account through trial and error, and as a result, my understanding, and the excel calculator improved. To ensure that the calculator was working correctly, I had the opportunity to sit down with an ION meter and send it voltage and current, as well as line and transformer details to get several points to compare my calculator with. This was interested, and developed my understanding for how Idaho Power gathers the power use information required to actually charge for power, and what all goes into it.
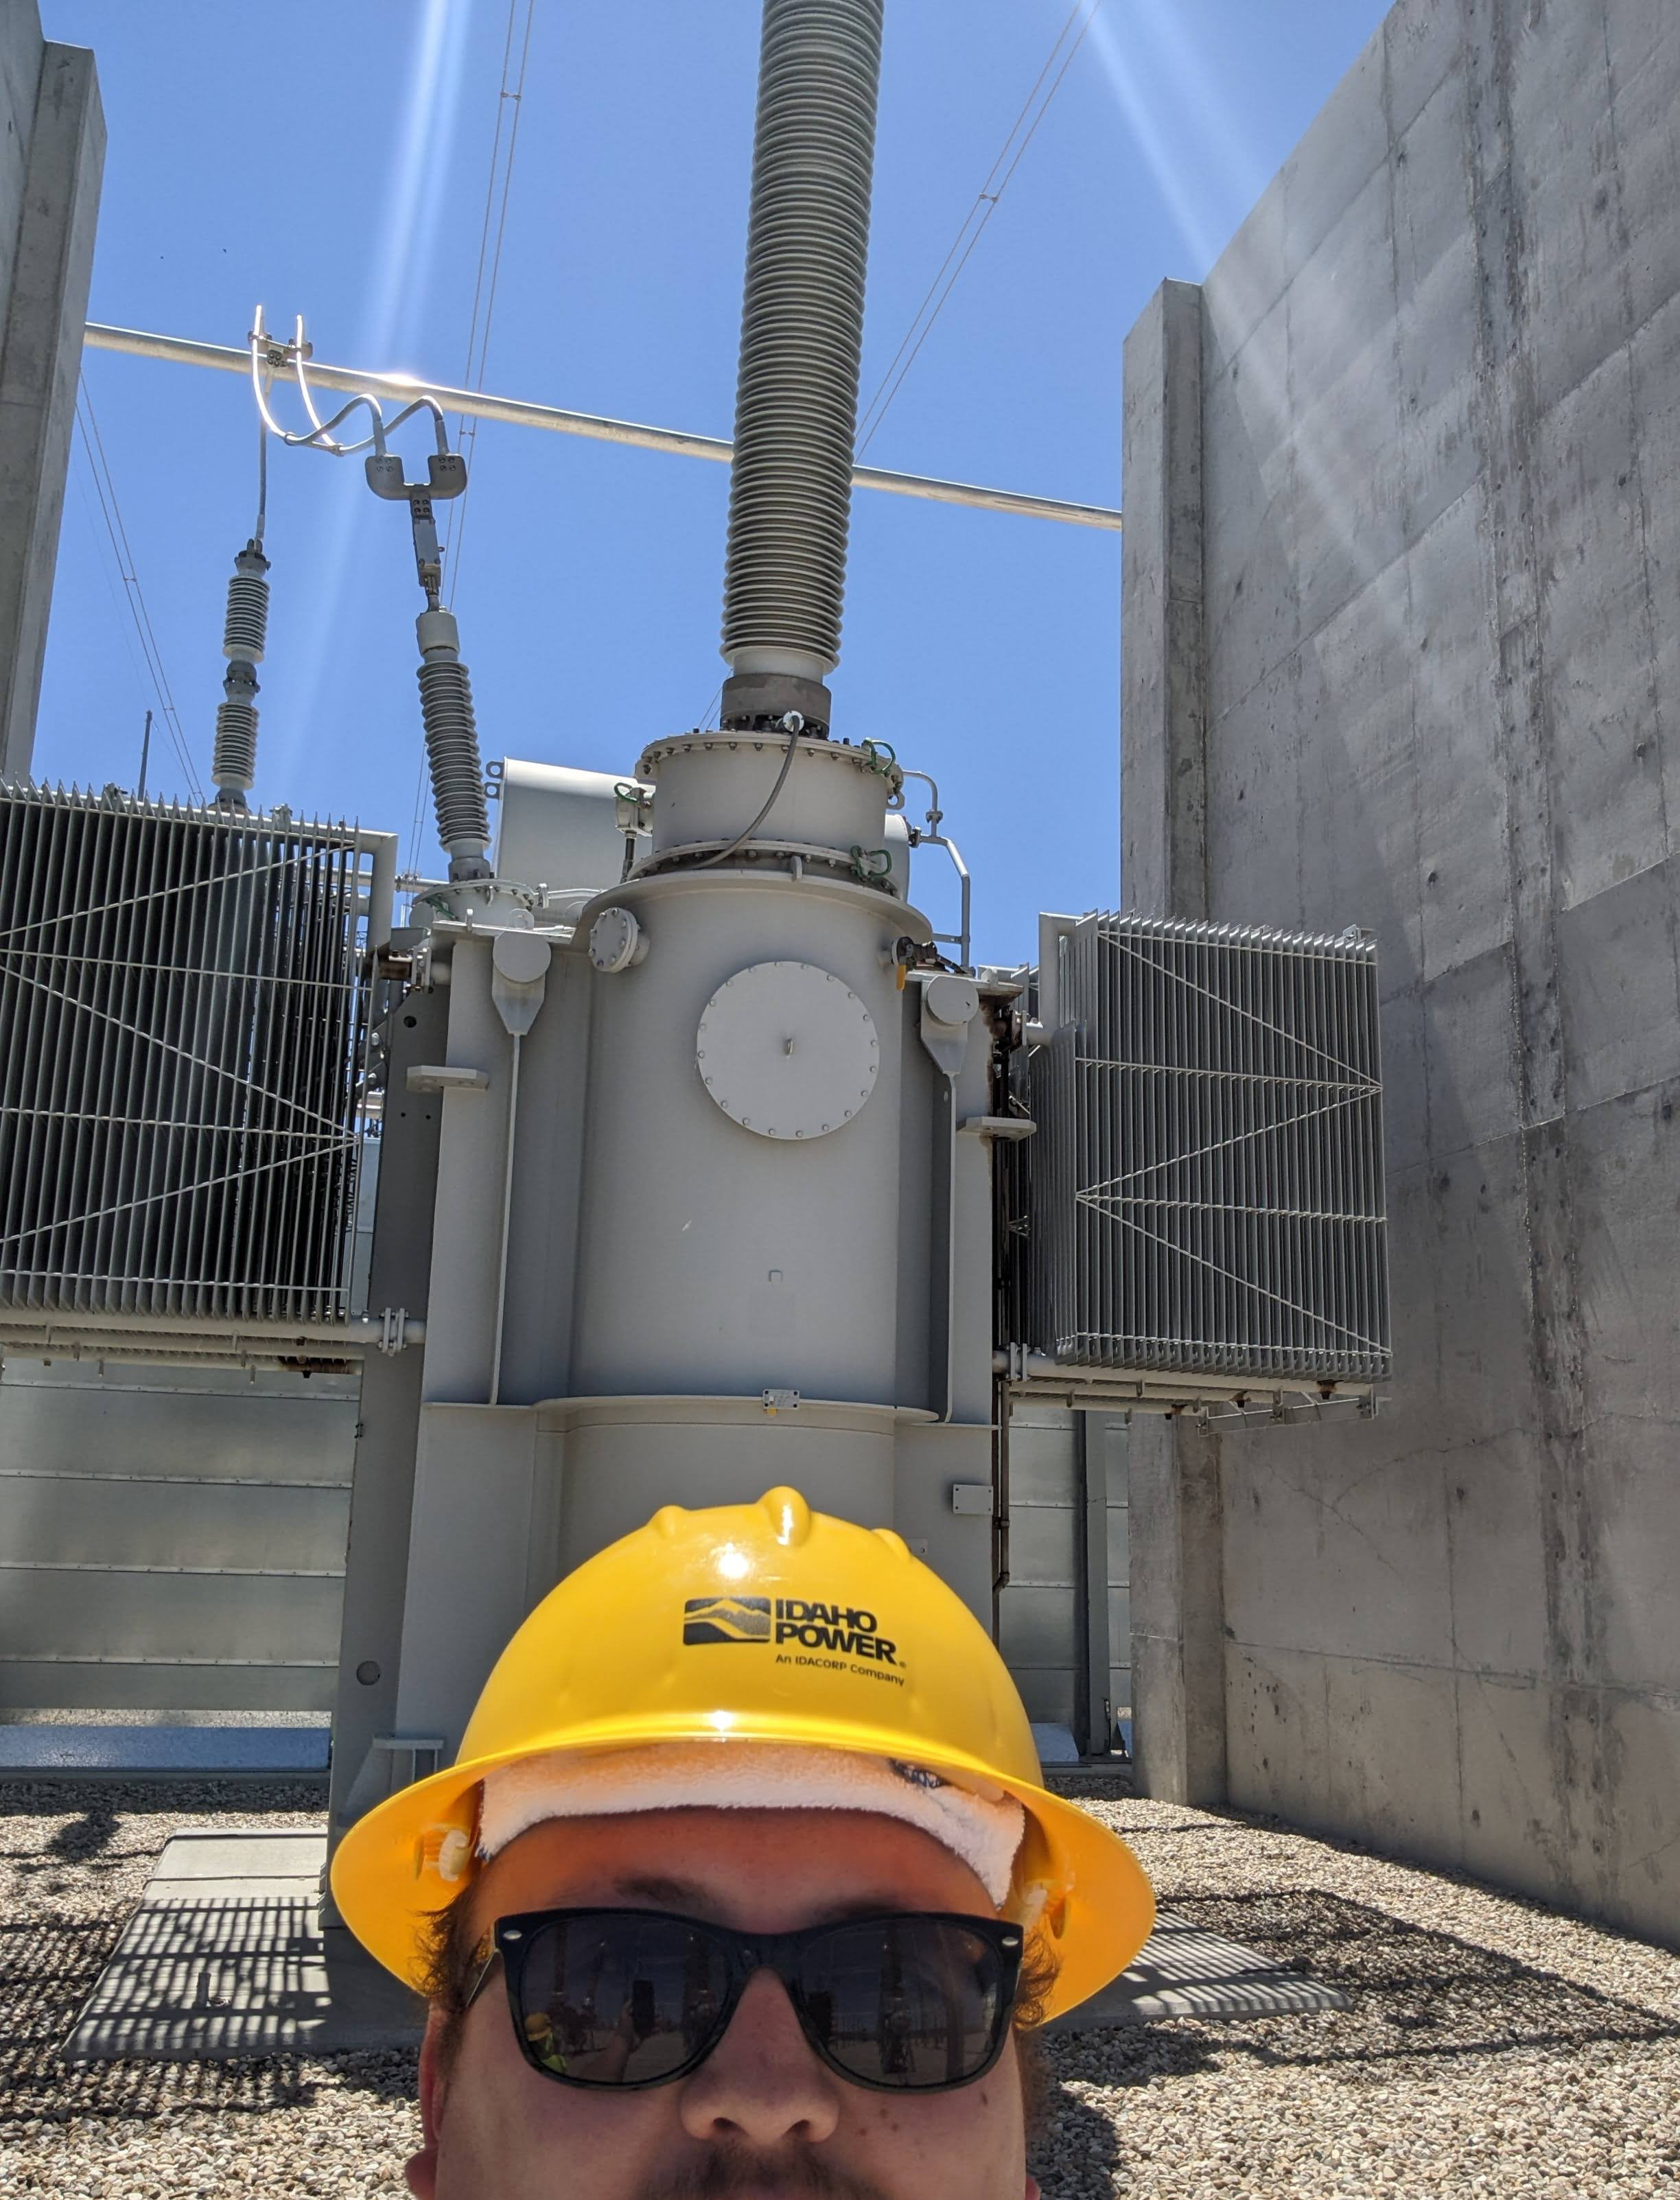
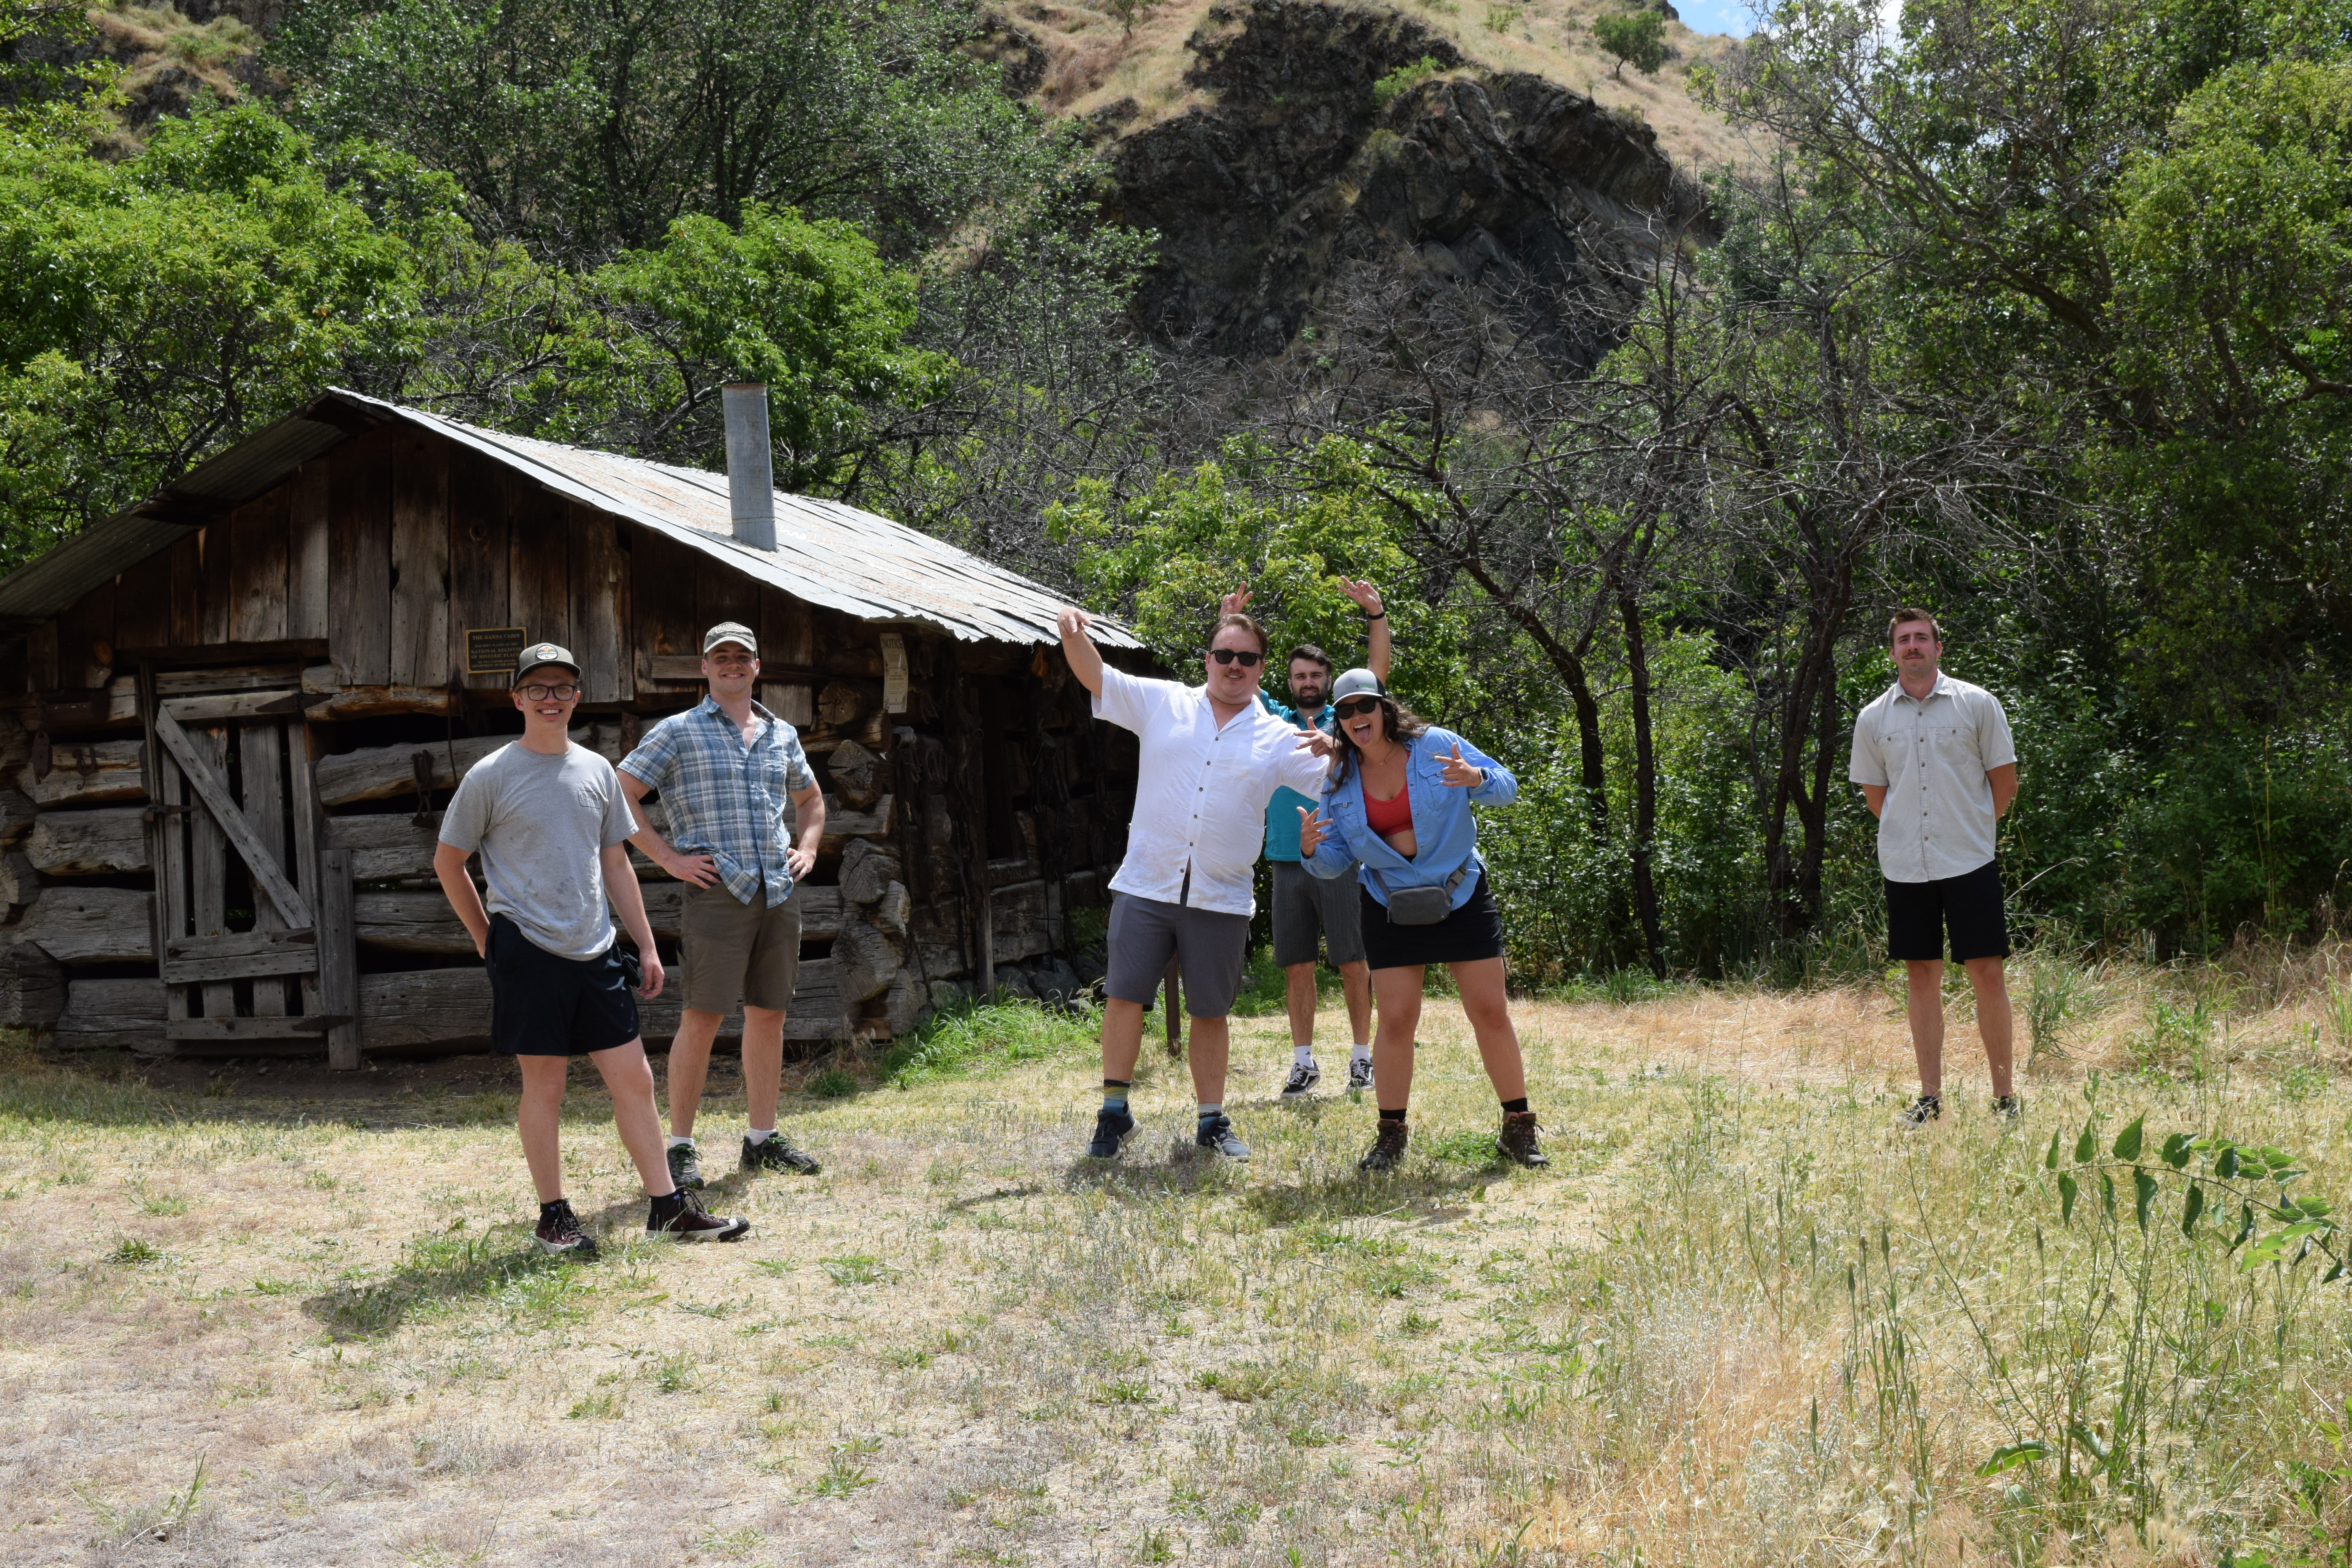
My time at Idaho Power was amazing, I had the opportunity to visit a few of the dams, Hells Canyon dam where me and the other interns had the chance to get on a jet boat and go up and down the river, then the next week Swan Falls dam, where we had the chance to go down near the actual dam turbines, which was amazing. Many other field trips inbetween up the internship nicely. One of the big IPC projects that is going on is the 500kV line, Boardman-to-Hemmingway, and we got the chance to see the Hemmingway substation that it will connect to. The machines and transformers there were incredibly massive to handle such high voltages.


I got the chance to follow around “Push Crews” who install the cables from the transformer level to residents. Every site I visited and every person I met was kind and helpful and very willing to answer any questions I had no matter how small or large. I was frankly surprised by that, from linemen who are out in the field keeping everything together and working, to the CEO, Lisa Grow, who I met in passing a few times. Everyone was kind and helpful. I also had the chance to make friends with the other interns, and it was so fun to have the opportunity to make friends who go to different schools, or are in different disciplines and spend time and talk with them about what their projects were. Getting their insight on what we were seeing and learning from the tours.

This internship was absolutely incredible, I am so glad I had the opportunity to work with everyone in Methods & Materials. Being able to sit and work with many experienced engineers and talk about concepts I had only ever worked with in class on a theoretical level was fascinating and allowed me to develop more understanding then I could have just in class. I don’t know if the conclusions I came to will be considered, or the calculator I developed used, though I have been told both are incredibly helpful, but what I learned in the process of developing them was invaluable. I really have enjoyed electrical engineering, the concepts I have found fascinating, and while power being a blank space in my understanding was scary to have while working at Idaho Power everyone was helpful and kind in helping me learn more then just the theoretical math behind it all, but how it is applied in real life.